Automated Enterprise Data Visualization: How We Cut Manual Data Processing Time by 95%
🔍 The Problem
A mid-sized manufacturing enterprise faced critical operational inefficiencies:
- Manual Data Consolidation: Finance, production, and tax teams maintained separate Excel files. Monthly data aggregation required 2-3 hours of manual work, with error rates reaching 15-20%.
- Delayed Decision-Making: Leadership couldn't access real-time performance metrics. Data requests triggered emergency overtime to compile reports.
- Scalability Issues: As the company expanded to multiple regions and subsidiaries, the manual process became unsustainable. Each new location meant exponential growth in data management overhead.
- Compliance Risk: Tax and financial data required precise calculations for regulatory reporting. Manual processes introduced compliance vulnerabilities.
⚙️ Our Solution
We engineered a Python-based data automation platform with the following architecture:
Data Ingestion Layer
- Automated Excel file parsing using Pandas and openpyxl
- Support for both legacy (.xls) and modern (.xlsx) formats
- Intelligent data validation and cleaning pipelines
Processing Engine
- Multi-dimensional data aggregation (production metrics, financial indicators, tax declarations)
- Real-time risk scoring calculations based on configurable thresholds
- Year-over-year trend analysis and anomaly detection
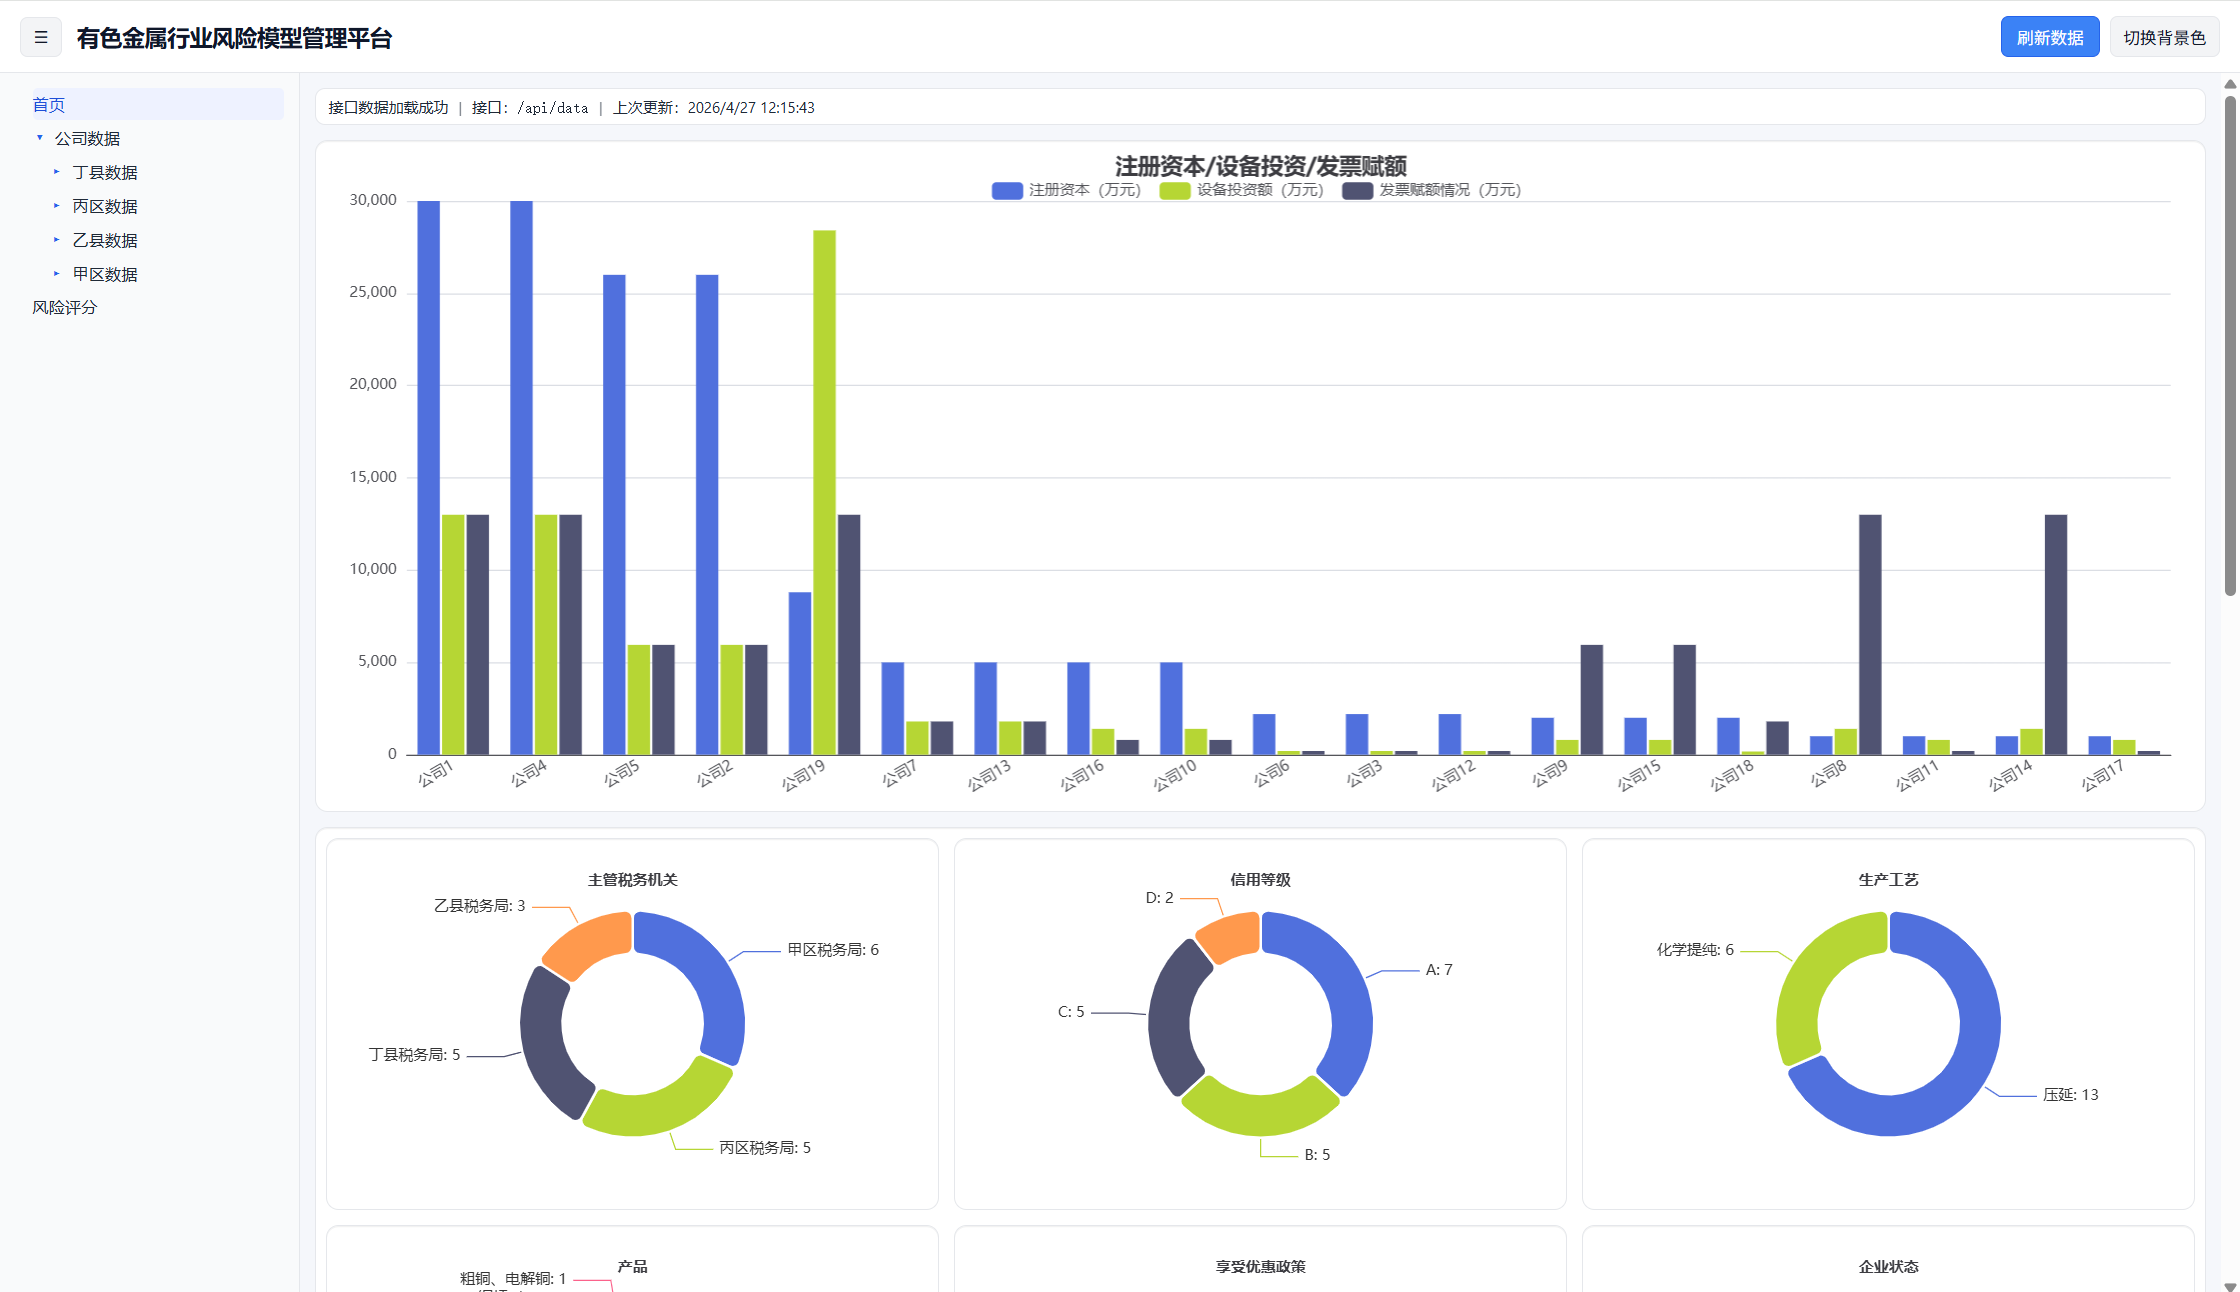
Visualization Dashboard
- Interactive ECharts-based frontend with responsive design
- Dark-theme UI optimized for extended viewing sessions
- Multi-level navigation: company data, regional comparisons, risk assessments
Security & Deployment
- Local-first architecture—all data processing occurs on-premises
- No cloud dependency, ensuring data sovereignty and compliance
- Clean, well-documented Python codebase for long-term maintainability
- Full remote collaboration support for ongoing enhancements
📈 The Impact
Quantified Results:
- ⏱️ Processing Time: Reduced from 120-180 minutes to 3 minutes (98% improvement)
- ✅ Accuracy: Error rate dropped from 15-20% to 0%
- 📊 Data Freshness: Real-time updates vs. monthly snapshots
- 👥 Team Capacity: Freed up 10+ hours per month per employee for strategic work
- 💰 ROI: Payback period achieved within 2 months
Operational Benefits:
- Executives now access live dashboards instead of waiting for reports
- Compliance teams can verify tax calculations instantly
- Regional managers compare performance across locations in real-time
- Scalable architecture supports unlimited data sources and company locations
🤝 Work With Us
Expert Python development team based in Wuhan, China. We deliver clean, well-documented code with full remote collaboration support. Trusted by clients across manufacturing, finance, and enterprise sectors. Our approach prioritizes data security, code maintainability, and long-term partnership.
